In a city as dynamic as Washington, D.C., the 311 system is more than just a customer service line—it’s a heartbeat of civic needs. For residents of Ward 7 and SMD 7B04, these service requests represent our shared commitment to a clean, safe, and functional neighborhood.
At Conformity Analytics, the goal is to move beyond anecdotes and look at the hard numbers. I’ve developed an interactive 311 Equity Tracker to audit the efficiency of our agencies’ responses to our calls. Here is what the data from 2024 through early (MARCH) 2026 tells us.
The 7B04 Snapshot: By the Numbers
Since 2024, our specific district has generated 3,839 service requests. This high volume is a testament to the engagement of our neighbors, but it also places a significant demand on city resources.
Primary Concern: Bulk Collection & Sanitation Enforcement
Total Requests (2024-2026): 3,839
Current Average Resolution Time: 7.8 Days
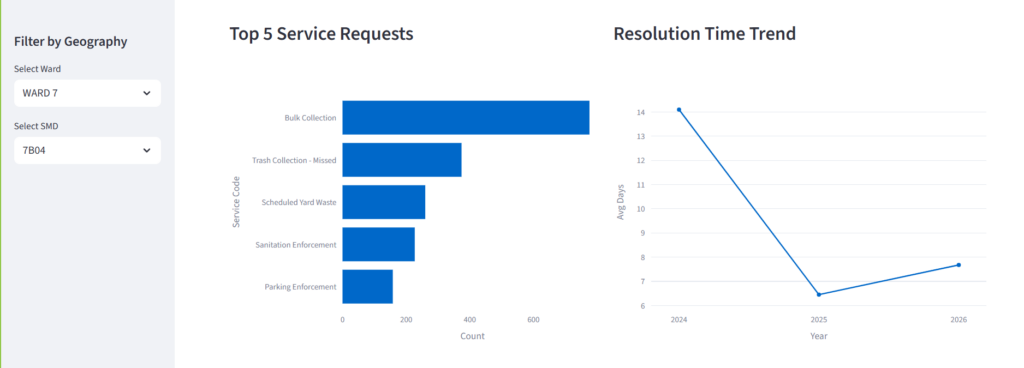
Finding 1: Efficiency is Trending (Mostly) Up
When we look at the trend line from 2024 to early 2026, there is a compelling story of improvement. In 2024, the average resolution time for a ticket in our area sat significantly higher. By 2025, that number dropped sharply, suggesting that agency responsiveness has tightened.
However, as of March 2026, we see a slight uptick in the average duration. This is a crucial metric for us to watch—is this a seasonal backlog due to winter weather, or a shift in agency prioritization?
Finding 2: The Sanitation Struggle
The data makes one thing undeniably clear: Bulk Collection is the dominant driver of 311 activity in 7B04. While high reporting numbers show that neighbors are doing the right thing by scheduling pickups, the sheer volume suggests a need for a more proactive policy approach to sanitation in the Pennsylvania Avenue East corridor.
Behind the Code: The Challenge of Spatial Equity
Building this tracker wasn’t just about making charts; it was about Data Integrity. One of the biggest hurdles was reconciling how the city tracks location.
Standard DC Open Data often uses different coordinate systems across different years. Without careful “spatial joining” and coordinate normalization, over 90% of our neighborhood data was essentially “invisible” to the analysis. By resolving these technical mismatches, we’ve ensured that every voice in 7B04 is counted in this performance audit.
Leave a Reply